Read this if you are in the senior living industry.
The COVID-19 pandemic wreaked havoc on the country and created challenges across the labor force, and senior living facilities weren’t spared. For senior living, the pandemic contributed to the widening of the care cost shortfall- by decreasing the available workforce pool through voluntary resignations and a demand for higher wages. That situation has remained, and senior living facilities are faced with many challenges, including rising labor costs. Of note:
- Across the nation, contract nursing labor utilization continues to increase, with an average 35% increase in contract agency hours used per patient day from 2020 to 2021.1
- Occupancy has been declining nationwide, driven by both diminishing referrals (infection control concerns, reduction of elective procedures such as joint replacements, and hospital capacity limitations) and the ability of facilities to accept patients (suspension of admissions due to inadequate staffing).
- Rising costs and diminishing occupancy have resulted in an average SNF $178.65 per patient day cost of care increase from 2020 to 2021.
- Nationally, the US Bureau of Labor Statistics2 (BLS) reports nursing and residential care facility employment declined 5% from 2019 to 2020, and further 5.7% from 2020 to 2021. Competition for workers resulted in noticeable wage increases, 10.4% in 2020, and 5.6% in 2021 (Table 1).
Table 1: Employment and wages, 2019 – 2021
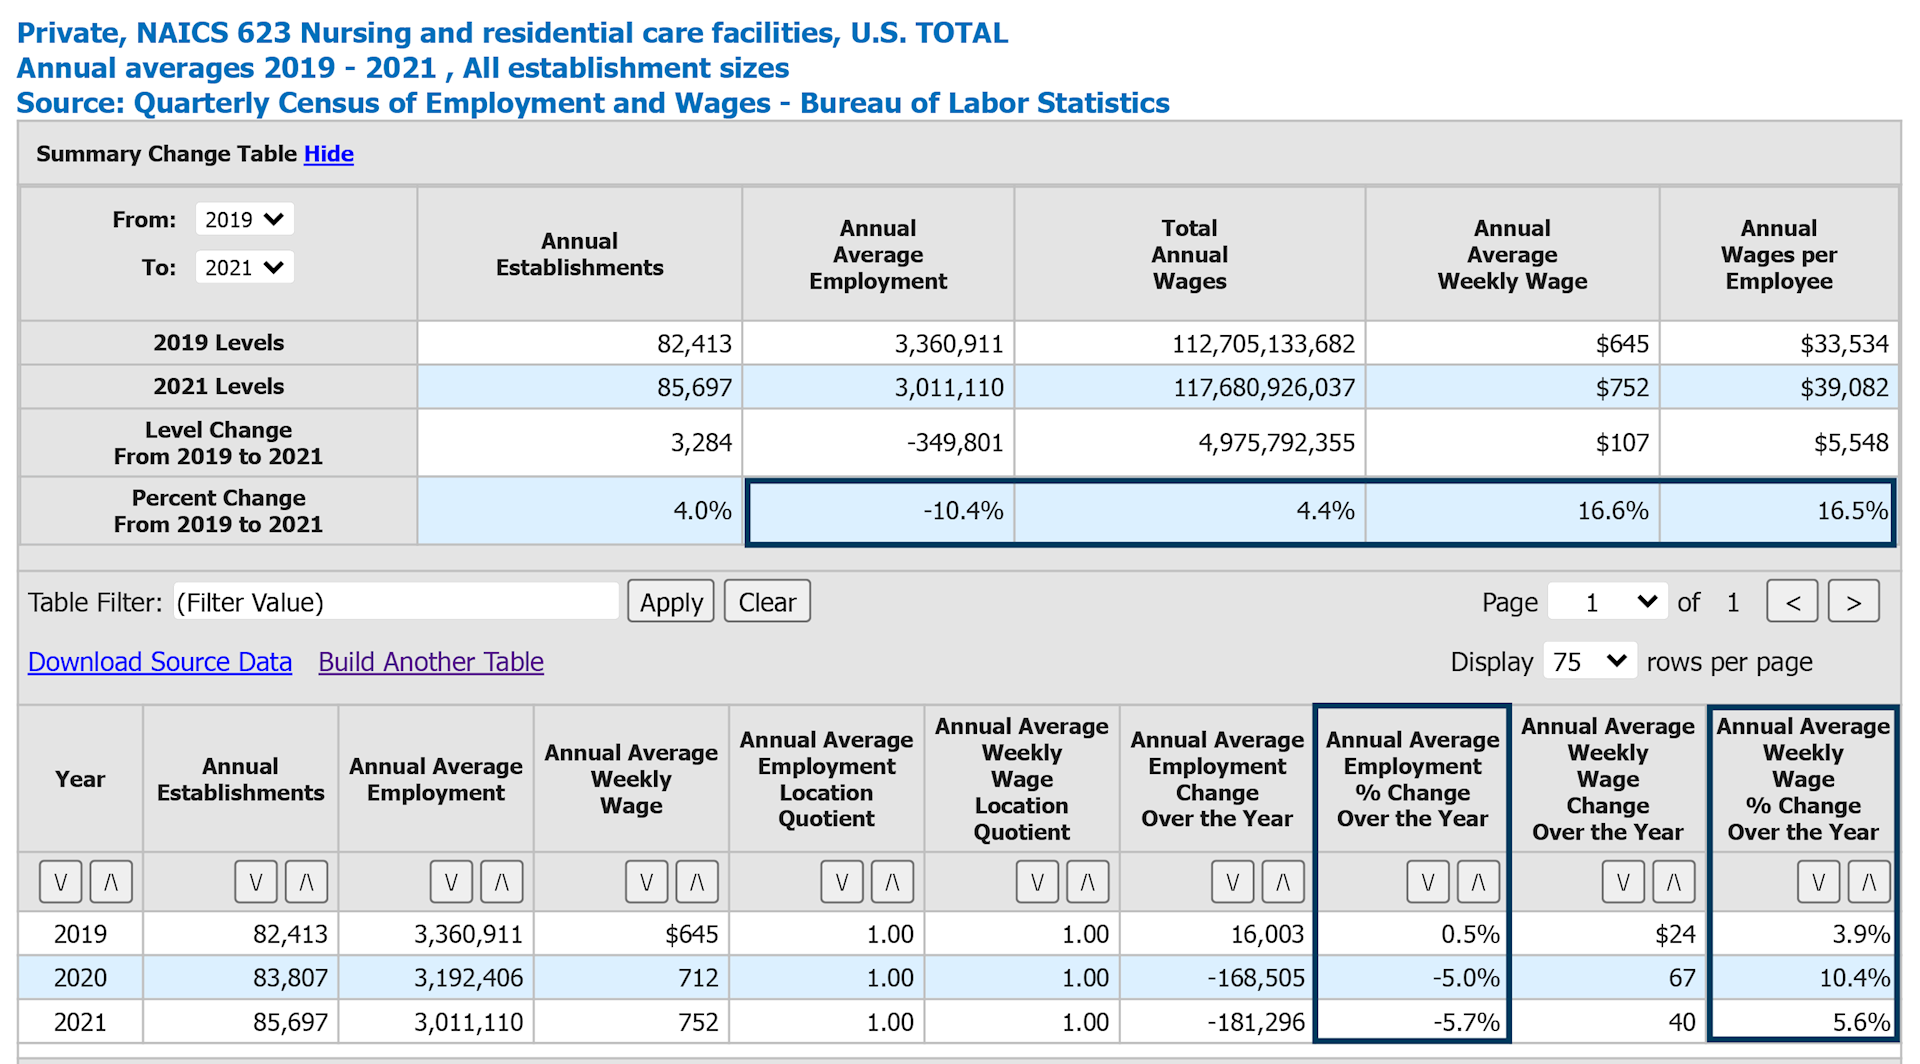
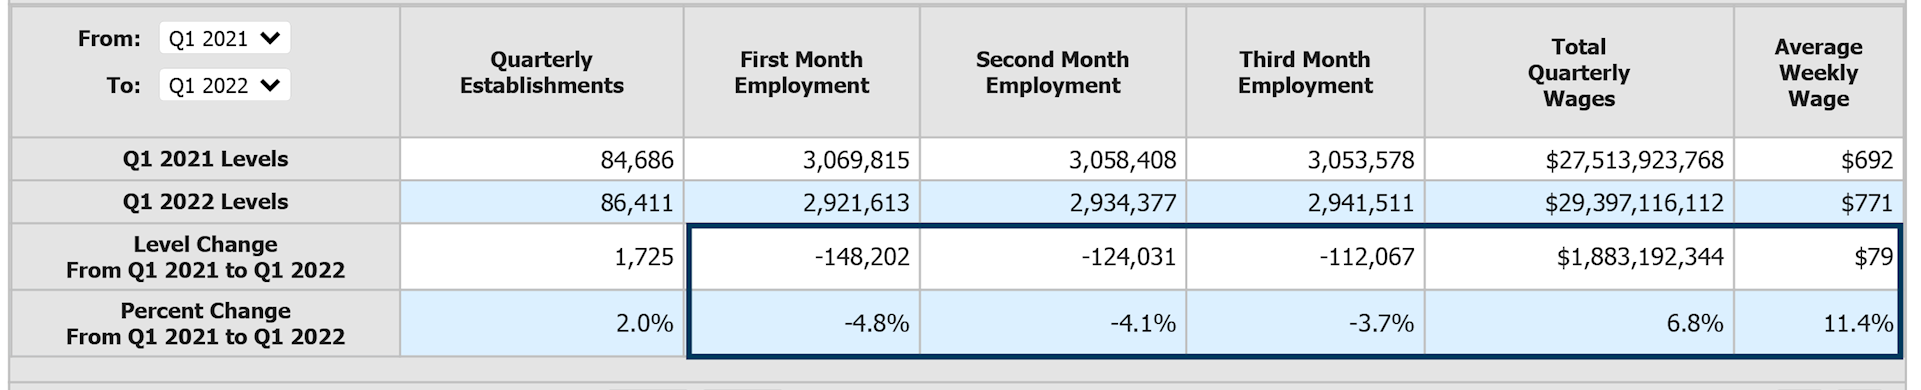
The first quarter of 2022 reveals a continuing reduction of employment coupled with continuing wage increases in the industry. The first quarter of 2022 showed an 11.4% increase in average weekly wage for nursing and residential care facilities over that same period in 2021, and continuing decline in employment (Table 2).
Table 2: Employment and wages, Q1 2022
COVID-19-related staff burnout, lack of childcare or school schedule disruptions, infection control requirements- such as mandatory masking or vaccinations- and other factors resulted in a rapid and significant reduction of clinical staff available for work.
Additional factors, such as migration of clinical staff from facility-based employment to a temporary contract agency, may have also contributed to the reduction of workforce in clinical occupations. CMS SNF Provider Information3 data comparison between August 2021 and August 2022 shows that all US regions reported a decline in average case-mix adjusted direct care hours per patient day (Figure 3) within a year. On average, 7.89% reduction in total hours reported, or 0.32 hours of services less per patient day. It is important to note that utilization of unlicensed staff (nursing assistants) has not changed significantly (57.2% in 2021 and 57.7% in 2022), indicating that nationwide availability of both licensed (RN, LPN) and unlicensed staff has decreased.
Table 3: Average case-mix adjusted direct care hours per patient day – August 2021 and August 2022 comparison
.svg)
Our interviews with long-term care facilities across the US have revealed that a number of facilities had to suspend admissions for a period of time, or close a portion of the facility, due to limited or inadequate staffing levels. Due to the nature of services, it mostly affects short stay rehabilitation unit admissions. For the majority of facilities, short stay revenue sources (such as Medicare) are more favorable and normally more profitable than long-term stays. The decrease in census (Table 4) drives the per diem costs up, and the loss of short-stay revenue continues to negatively impact the bottom line. Additionally, with a significant reduction of short stay rehabilitation volume, some highly trained employees of the facilities (such as therapists, clinical directors, dieticians, and others) may be less utilized, and potentially harder to retain.
Table 4: Average Medicare-certified facility occupancy, 2019 – 2021
.svg)
The increased cost of labor is one of the major per diem cost increase drivers for senior living facilities. The tight labor market has led to higher labor costs, increased utilization of contract labor, as well as reductions or suspensions in admissions due to lack of staffing.
Table 5: Average Medicare-certified facility direct care labor cost per patient day (wages, benefits, contract labor), 2019 – 2021
.svg)
Table 6: Average Medicare-certified facility direct care contract wages, 2019 – 2021
.svg)
Many states facilitate labor-related programs aimed at increasing labor pool and staff retention through innovative programs, as well as considering waivers related to staff certification and delegation of duties requirements. Due to timing, the job outlook could not be forecasted with the effects of the new initiatives, as there is no data yet available on effectiveness of these programs.
If you would like more information, or have questions about your specific situation, please contact our senior living and long-term care team. We’re here to help.
1 HCRIS as filed SNF Medicare (full utilization) cost reports, 2019 – 2021
2 Bureau of Labor Statistics, 2022
3 The Centers for Medicare & Medicaid Services, 2022
 Skip to Main Content